apparently there is some problem in visualization for someone (colors and images). I'm not willing to debug blogger so here is a link to a public doc containing the same info about openstack with vlan net debugging
Everything You Always Wanted to Know About Openstack network*
* But Were Afraid to Ask
AKA Openstack debugging VLAN setup

Disclaimer
Here is a tentative guide to test and debug mostly the networking in the Openstack cloud world.
We have spent huge amount of time looking at packet dumps in order to distill this information for you in the belief that, following the recipes outlined in the following pages, you will have an easier time !
Keep in mind that this is coming more from a day by day debug than from a structured plan so I tried to separate the pieces according to the architecture that I have in mind... but is and will remain a work in progress.
Reference setup:
The setup is the following:
- compute node - Ubuntu server 14 - 4 ethernet interfaces mapped on em1-4 (3 used)
- controller - compute node - Ubuntu server 14 - 4 ethernet interfaces mapped on em1-4 (3 used)
- network node - Ubuntu server 14 - 4 ethernet interfaces mapped on em1-4 (3 used)
The networking configuration is implemented within neutron service and based on a VLAN approach so to obtain a completly L2 separation of a multiple tenant environment.
Follow the openstack guide to configure the services (in appendix the configuration files that has been used in this case and few configuration scripts).
Preliminary checks
Once you agreed with your network administrators on the switches configuration (If you have no direct access to them) let's double check the port configuration for the vlan ids:
# tcpdump -vvv -s 1500 ether proto 0x88cc -i em1
(wait for a packet and then CTRL-c)
this command will give you some information about the switch that you are connected to and the VLAN configuration. NB if the port is in trunk you may get the same result as if the port is without VLAN settings.
An example of the output of the command for an interface attached to a port that is configured as access:
tcpdump: WARNING: em1: no IPv4 address assigned
tcpdump: listening on em1, link-type EN10MB (Ethernet), capture size 1500 bytes
12:33:03.255101 LLDP, length 351
[...]
System Name TLV (5), length 13: stackdr2.GARR
0x0000: 7374 6163 6b64 7232 2e47 4152 52
[...]
Port Description TLV (4), length 21: GigabitEthernet2/0/31
[...]
Organization specific TLV (127), length 6: OUI Ethernet bridged (0x0080c2)
Port VLAN Id Subtype (1)
port vlan id (PVID): 320
[...]
1 packet captured
1 packet received by filter
0 packets dropped by kernel
an example of the output of the command for an interface attached to a port that is configured as trunk:
# tcpdump -vvv -s 1500 ether proto 0x88cc -i em3
tcpdump: WARNING: em3: no IPv4 address assigned
tcpdump: listening on em3, link-type EN10MB (Ethernet), capture size 1500 bytes
12:32:11.513135 LLDP, length 349
[...]
System Name TLV (5), length 13: stackdr2.GARR
[...]
Port Description TLV (4), length 20: GigabitEthernet2/0/3
[...]
Port VLAN Id Subtype (1)
port vlan id (PVID): 1
[...]^C
1 packet captured
1 packet received by filter
0 packets dropped by kernel
Check Interfaces
On compute nodes, use the following command to see information about interfaces: IPs, VLAN ids and to know wether the interfaces are up:
# ip a
one good initial sanity check is to make sure that your interfaces are up:
# ip a |grep em[1,3] |grep state
2: em3: <BROADCAST,MULTICAST,UP,LOWER_UP> mtu 1500 qdisc mq master ovs-system state UP group default qlen 1000
6: em1: <BROADCAST,MULTICAST,UP,LOWER_UP> mtu 1500 qdisc mq state UP group default qlen 1000
37: br-em3: <BROADCAST,UP,LOWER_UP> mtu 1500 qdisc noqueue state UNKNOWN group default
Troubleshooting Open vSwitch
Open vSwitch is a multilayer virtual switch. Full documentation can be found at the website. In practice you need to ensure that the required bridges (br-int, br-ex, br-em1, br-em3 etc) exist and have the proper ports connected to them with the ovs-vsctl and ovs-ofctl commands.
To list the bridges on a system (VLAN networks are trunked through the em3 network interface):
# ovs-vsctl list-br
br-em3
br-ex
br-int
Example:on the network node (you should follow the same logic on the compute one)
Let’s check the chain of ports and bridges. The bridge br-em3 contains the physical network interface em3 (trunk network) and the virtual interface phy-br-em3 attached to the int-br-em3 of the br-int:
# ovs-vsctl list-ports br-em3
em3
phy-br-em3
# ovs-vsctl show
Bridge "br-em3"
Port "em3"
Interface "em3"
Port "phy-br-em3"
Interface "phy-br-em3"
type: patch
options: {peer="int-br-em3"}
Port "br-em3"
Interface "br-em3"
type: internal
br-int contains int-br-em3 which pairs with phy-br-em3 to connect to the physical network which is used to connect to the compute nodes and the TAP devices that connect to the DHCP instances and the Tap interfaces that connects to the virtual routers:
# ovs-vsctl list-ports br-int
int-br-em3
int-br-ex
qr-9ae4acd4-92
qr-ae75168a-67
qr-e323976e-2b
qr-e3debf8d-ee
tap1474f18d-a9
tap7c29ce27-4e
tapc974ab53-25
tapd9762af3-4b
# ovs-vsctl show
Bridge br-int
fail_mode: secure
Port "tapd9762af3-4b"
tag: 5
Interface "tapd9762af3-4b"
type: internal
Port int-br-ex
Interface int-br-ex
type: patch
options: {peer=phy-br-ex}
[...]
fail_mode: secure
Port "tapd9762af3-4b"
tag: 5
Interface "tapd9762af3-4b"
type: internal
Port int-br-ex
Interface int-br-ex
type: patch
options: {peer=phy-br-ex}
[...]
Port "qr-9ae4acd4-92"
tag: 1
Interface "qr-9ae4acd4-92"
type: internal
Port br-int
Interface br-int
type: internal
Port "tap1474f18d-a9"
tag: 3
Interface "tap1474f18d-a9"
type: internal
tag: 1
Interface "qr-9ae4acd4-92"
type: internal
Port br-int
Interface br-int
type: internal
Port "tap1474f18d-a9"
tag: 3
Interface "tap1474f18d-a9"
type: internal
# ovs-vsctl list-ports br-ex
Bridge br-ex
Port br-ex
Interface br-ex
type: internal
Port "em4"
Interface "em4"
Port phy-br-ex
Interface phy-br-ex
type: patch
options: {peer=int-br-ex}
Bridge br-ex
Port br-ex
Interface br-ex
type: internal
Port "em4"
Interface "em4"
Port phy-br-ex
Interface phy-br-ex
type: patch
options: {peer=int-br-ex}
If any of these links is missing or incorrect, it suggests a configuration error.
NB: you can also check the correct vlan tags translation along the overall chain with ovs-ofctl commands i.e. (more details follows)
# ovs-ofctl dump-flows br-int
NXST_FLOW reply (xid=0x4):
cookie=0x0, duration=6718.658s, table=0, n_packets=0, n_bytes=0, idle_age=6718, priority=3,in_port=1,dl_vlan=325 actions=mod_vlan_vid:4,NORMAL
cookie=0x0, duration=6719.335s, table=0, n_packets=0, n_bytes=0, idle_age=6719, priority=3,in_port=1,dl_vlan=327 actions=mod_vlan_vid:3,NORMAL
cookie=0x0, duration=6720.508s, table=0, n_packets=3, n_bytes=328, idle_age=6715, priority=3,in_port=1,dl_vlan=328 actions=mod_vlan_vid:1,NORMAL
cookie=0x0, duration=5840.156s, table=0, n_packets=139, n_bytes=13302, idle_age=972, priority=3,in_port=1,dl_vlan=320 actions=mod_vlan_vid:5,NORMAL
cookie=0x0, duration=6719.906s, table=0, n_packets=58, n_bytes=6845, idle_age=6464, priority=3,in_port=1,dl_vlan=324 actions=mod_vlan_vid:2,NORMAL
cookie=0x0, duration=6792.845s, table=0, n_packets=555, n_bytes=100492, idle_age=9, priority=2,in_port=1 actions=drop
cookie=0x0, duration=6792.025s, table=0, n_packets=555, n_bytes=97888, idle_age=9, priority=2,in_port=2 actions=drop
cookie=0x0, duration=6793.667s, table=0, n_packets=203, n_bytes=22402, idle_age=4535, priority=1 actions=NORMAL
cookie=0x0, duration=6793.605s, table=23, n_packets=0, n_bytes=0, idle_age=6793, priority=0 actions=drop
Bridges can be added with ovs-vsctl add-br, and ports can be added to bridges with ovs-vsctl add-port.
Troubleshoot neutron traffic
Refer to the Cloud Administrator Guide for a variety of networking scenarios and their connection paths. We use the Open vSwitch (OVS) backend.
See the following figure for reference.
- The instance generates a packet and sends it through the virtual NIC inside the instance, such as eth0.
- The packet transfers to a Test Access Point (TAP) device on the compute host, such as tap1d40b89c-fe. You can find out what TAP is being used by looking at the /etc/libvirt/qemu/instance-xxxxxxxx.xml file.
following an example with the interesting parts in evidence:
<domain type='kvm'>
<name>instance-00000015</name>
<uuid>cc2b7876-6d3a-4b78-b817-ed36146a9b9e</uuid>
[....]
<name>instance-00000015</name>
<uuid>cc2b7876-6d3a-4b78-b817-ed36146a9b9e</uuid>
[....]
<controller type='pci' index='0' model='pci-root'/>
<interface type='bridge'>
<mac address='fa:16:3e:a4:56:3d'/>
<source bridge='qbrff8e411e-6e'/>
<target dev='tapff8e411e-6e'/>
<model type='virtio'/>
<address type='pci' domain='0x0000' bus='0x00' slot='0x03' function='0x0'/>
</interface>
<serial type='file'>
<source
<interface type='bridge'>
<mac address='fa:16:3e:a4:56:3d'/>
<source bridge='qbrff8e411e-6e'/>
<target dev='tapff8e411e-6e'/>
<model type='virtio'/>
<address type='pci' domain='0x0000' bus='0x00' slot='0x03' function='0x0'/>
</interface>
<serial type='file'>
<source
[....]
another means of finding the device name is to use the neutron commands: to get the port ID associated with IP address 192.168.20.103, do this
- # neutron port-list | grep 192.168.4.102| cut -d \| -f 2
ff8e411e-6e08-499f-b9a5-0beca2c94b85
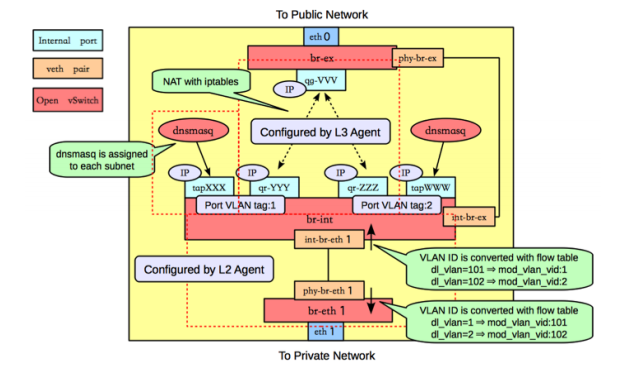
Looking also at the neutron part and highlighting the VLAN configuration we have something like (I recycled the image so the br-eth1 is br-emXX in my setup and ethYY are emZZ but the flow is the point that I want to stress here):
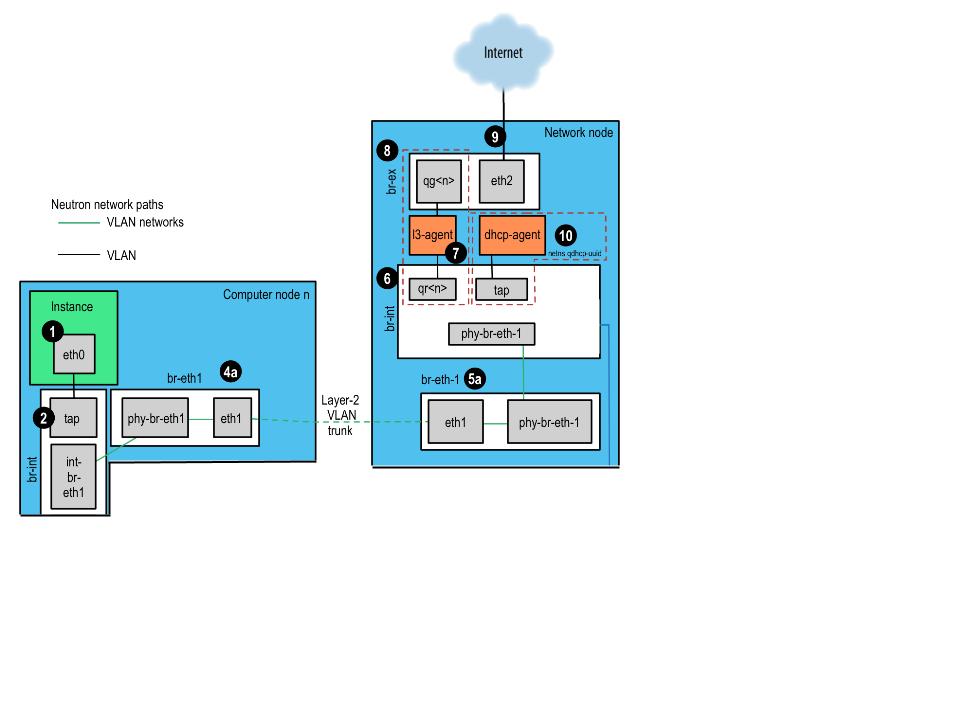
- The TAP device is connected to the integration bridge, br-int. This bridge connects all the instance TAP devices and any other bridges on the system. int-br-eth1 is one half of a veth pair connecting to the bridge br-eth1, which handles VLAN networks trunked over the physical Ethernet device eth1.
- The TAP devices and veth devices are normal Linux network devices and may be inspected with the usual tools, such as ip and tcpdump. Open vSwitch internal devices are only visible within the Open vSwitch environment.
# tcpdump -i int-br-em3
tcpdump: int-br-em3: No such device exists
(SIOCGIFHWADDR: No such device)
tcpdump: int-br-em3: No such device exists
(SIOCGIFHWADDR: No such device)
- To watch packets on internal interfaces you need to create a dummy network device and add it to the bridge containing the internal interface you want to snoop on. Then tell Open vSwitch to mirror all traffic to or from the internal port onto this dummy port so to run tcpdump on the dummy interface and see the traffic on the internal port.
- Capture packets from an internal interface on integration bridge, br-int (advanced):
- Create and bring up a dummy interface, snooper0:
- # ip link add name snooper0 type dummy
- # ip link set dev snooper0 up
- Add device snooper0 to bridge br-int:
# ovs-vsctl add-port br-int snooper0
- Create mirror of for example int-br-em3 interface to snooper0 (all in one line - returns UUID of mirror port):
# ovs-vsctl -- set Bridge br-int mirrors=@m -- --id=@snooper0 get Port snooper0 -- --id=@int-br-em3 get Port int-br-em3 -- --id=@m create Mirror name=mymirror select-dst-port=@int-br-em3 select-src-port=@int-br-em3 output-port=@snooper0
dcce2c59-be1a-4f2d-b00b-9d906c77ee8a
- and from here you can see the traffic going through int-br-em3 with a tcpdump -i snooper0.
- Clean up mirrors:
# ovs-vsctl clear Bridge br-int mirrors
# ovs-vsctl del-port br-int snooper0
# ip link delete dev snooper0
# ovs-vsctl del-port br-int snooper0
# ip link delete dev snooper0
On the integration bridge, networks are distinguished using internal VLAN ids (unrelated to the segmentation IDs used in the network definition and on the physical wire) regardless of how the networking service defines them. This allows instances on the same host to communicate directly without transiting the rest of the virtual, or physical, network. On the br-int, incoming packets are translated from external tags to internal tags. Other translations also happen on the other bridges and will be discussed later.
- To discover which internal VLAN tag is in use for a given external VLAN by using the ovs-ofctl command:
- Find the external VLAN tag of the network you're interested in with
# neutron net-show --fields provider:segmentation_id <network name>
+---------------------------+--------------------------------------+
| Field | Value |
+---------------------------+--------------------------------------+
| provider:network_type | vlan |
| provider:segmentation_id | 324 |
+---------------------------+--------------------------------------+
+---------------------------+--------------------------------------+
| Field | Value |
+---------------------------+--------------------------------------+
| provider:network_type | vlan |
| provider:segmentation_id | 324 |
+---------------------------+--------------------------------------+
- Grep for the provider:segmentation_id, 324 in this case, in the output of ovs-ofctl dump-flows br-int:
# ovs-ofctl dump-flows br-int|grep vlan=324
cookie=0x0, duration=105039.122s, table=0, n_packets=5963, n_bytes=482203, idle_age=1104, hard_age=65534, priority=3,in_port=1,dl_vlan=324 actions=mod_vlan_vid:1,NORMAL
- Here you can see packets received on port ID 1 with the VLAN tag 324 are modified to have the internal VLAN tag 1. Digging a little deeper, you can confirm that port 1 is in fact :
- # ovs-ofctl show br-int
OFPT_FEATURES_REPLY (xid=0x2): dpid:0000029a51549b40
n_tables:254, n_buffers:256
capabilities: FLOW_STATS TABLE_STATS PORT_STATS QUEUE_STATS ARP_MATCH_IP
actions: OUTPUT SET_VLAN_VID SET_VLAN_PCP STRIP_VLAN SET_DL_SRC SET_DL_DST SET_NW_SRC SET_NW_DST SET_NW_TOS SET_TP_SRC SET_TP_DST ENQUEUE
1(int-br-em3): addr:52:40:bd:b3:88:9c
config: 0
state: 0
speed: 0 Mbps now, 0 Mbps max
2(qvof3b63d31-a0): addr:4e:db:74:04:53:4d
config: 0
state: 0
current: 10GB-FD COPPER
speed: 10000 Mbps now, 0 Mbps max
3(qvo65fb5ad8-b5): addr:92:75:b8:03:cc:1d
config: 0
state: 0
current: 10GB-FD COPPER
speed: 10000 Mbps now, 0 Mbps max
4(qvoa6e8c6e3-1c): addr:82:22:71:c5:4e:f8
config: 0
state: 0
current: 10GB-FD COPPER
speed: 10000 Mbps now, 0 Mbps max
5(qvo1d40b89c-fe): addr:5e:e3:15:53:e5:16
config: 0
state: 0
current: 10GB-FD COPPER
speed: 10000 Mbps now, 0 Mbps max
6(qvoff8e411e-6e): addr:02:a9:38:d6:88:22
config: 0
state: 0
current: 10GB-FD COPPER
speed: 10000 Mbps now, 0 Mbps max
LOCAL(br-int): addr:02:9a:51:54:9b:40
config: 0
state: 0
speed: 0 Mbps now, 0 Mbps max
OFPT_GET_CONFIG_REPLY (xid=0x4): frags=normal miss_send_len=0
- (NB this is NOT valid if you are using a GRE tunnel) VLAN-based networks exit the integration bridge via a veth interface i.e. int-br-em3 (int-br-eth1 in the picture) and arrive on a bridge i.e. br-em3 (br-eth1) on the other member of the veth pair phy-br-em3 (phy-br-eth1). Packets on this interface arrive with internal VLAN tags and are translated to external tags in the reverse of the process described above:
# ovs-ofctl dump-flows br-em3|grep 324
cookie=0x0, duration=105402.89s, table=0, n_packets=7374, n_bytes=905197, idle_age=1468, hard_age=65534, priority=4,in_port=2,dl_vlan=1 actions=mod_vlan_vid:324,NORMAL
- Packets, now tagged with the external VLAN tag, then exit onto the physical network via em3 (eth1). The Layer2 switch this interface is connected to must be configured as trunk on the VLAN IDs used. The next hop for this packet must also be on the same layer-2 network.
- The packet is then received on the network node. Note that any traffic to the l3-agent or dhcp-agent will be visible only within their network namespace. Watching any interfaces outside those namespaces, even those that carry the network traffic, will only show broadcast packets like Address Resolution Protocols (ARPs), but unicast traffic to the router or DHCP address will not be seen. See Dealing with Network Namespaces for detail on how to run commands within these namespaces.
- Alternatively, it is possible to configure VLAN-based networks to use external routers rather than the l3-agent shown here, so long as the external router is on the same VLAN:
- VLAN-based networks are received as tagged packets on a physical network interface, eth1 in this example. Just as on the compute node, this interface is a member of the br-eth1 bridge.
- GRE-based networks will be passed to the tunnel bridge br-tun, which behaves just like the GRE interfaces on the compute node.
- Next, the packets from either input go through the integration bridge, again just as on the compute node.
- The packet then makes it to the l3-agent. This is actually another TAP device within the router's network namespace. Router namespaces are named in the form qrouter-<router-uuid>. Running ip a within the namespace will show the TAP device name, qr-e6256f7d-31 in this example:
- # ip netns exec qrouter-e521f9d0-a1bd-4ff4-bc81-78a60dd88fe5 ip a|grep state
10: qr-e6256f7d-31: <BROADCAST,UP,LOWER_UP> mtu 1500 qdisc noqueue \
state UNKNOWN
11: qg-35916e1f-36: <BROADCAST,MULTICAST,UP,LOWER_UP> mtu 1500 \
qdisc pfifo_fast state UNKNOWN qlen 500
28: lo: <LOOPBACK,UP,LOWER_UP> mtu 16436 qdisc noqueue state UNKNOWN - The qg-<n> interface in the l3-agent router namespace sends the packet on to its next hop through device eth2 on the external bridge br-ex. This bridge is constructed similarly to br-eth1 and may be inspected in the same way.
- This external bridge also includes a physical network interface, eth2 in this example, which finally lands the packet on the external network destined for an external router or destination.
- DHCP agents running on OpenStack networks run in namespaces similar to the l3-agents. DHCP namespaces are named qdhcp-<uuid> and have a TAP device on the integration bridge. Debugging of DHCP issues usually involves working inside this network namespace.
Debug a problem along the Path
Ping is your best friend ! From an instance:
- See whether you can ping an external host, such as 8.8.8.8 (google which usually is up: from stats 99.9%).
- If you can't, try the IP address of the compute node where the virtual machine is hosted.
- If you can ping this IP, then the problem is somewhere between the compute node and that compute node's gateway.
- If you can't the problem is between the instance and the compute node. Check also the bridge connecting the compute node's main NIC with the vnet NIC of the vm.
- Launch a second instance and see whether the two instances can ping each other. If they can, the issue might be related to the firewall on the compute node. See further for iptables debugging
tcpdump
This is your second best friend to help with troubleshooting network issues. Using tcpdump at several points along the network path should help finding where the problem is.
For example, run the following command:
tcpdump -i any -n -v \ 'icmp[icmptype] = icmp-echoreply or icmp[icmptype] =
icmp-echo'
icmp-echo'
on:
- An external server outside of the cloud (in the example 193.206.159.201)
- A compute node ()
- An instance running on that compute node
In this example, these locations have the following IP addresses:
Instance 10.0.2.24; 203.0.113.30
Compute Node 10.0.0.42; 203.0.113.34
External Server 1.2.3.4
Compute Node 10.0.0.42; 203.0.113.34
External Server 1.2.3.4
Next, open a new shell to the instance and then ping the external host where tcpdump is running. If the network path to the external server and back is fully functional, you see something like the following:
On the external server:
$ tcpdump -i any -n -v \ 'icmp[icmptype] = icmp-echoreply or icmp[icmptype] =
icmp-echo'
tcpdump: listening on any, link-type LINUX_SLL (Linux cooked), capture size 65535 bytes
10:20:23.517242 IP (tos 0x0, ttl 64, id 65416, offset 0, flags [none], proto ICMP (1), length 84)
193.206.159.201 > 90.147.91.10: ICMP echo reply, id 1606, seq 28, length 64
which received the ping request and sent a ping reply
On the compute node you can follow the traffic along the path:
- on the tap device which is connecting the VM to the linux bridge (to find the tap see previous)
# tcpdump -i tap88ab3af7-7d -n -v \ 'icmp[icmptype] = icmp-echoreply or icmp[icmptype] =
icmp-echo'
tcpdump: WARNING: tap88ab3af7-7d: no IPv4 address assigned
tcpdump: listening on tap88ab3af7-7d, link-type EN10MB (Ethernet), capture size 65535 bytes
10:36:31.000419 IP (tos 0x0, ttl 64, id 1469, offset 0, flags [DF], proto ICMP (1), length 84)
192.168.4.103 > 8.8.8.8: ICMP echo request, id 1709, seq 1, length 64
- on the two sides of the veth pair between the linux bridge and the OVS br-int
# tcpdump -i qbr88ab3af7-7d -n -v \ 'icmp[icmptype] = icmp-echoreply or icmp[icmptype] =
icmp-echo'
tcpdump: WARNING: qbr88ab3af7-7d: no IPv4 address assigned
tcpdump: listening on qbr88ab3af7-7d, link-type EN10MB (Ethernet), capture size 65535 bytes
10:36:59.035767 IP (tos 0x0, ttl 64, id 1497, offset 0, flags [DF], proto ICMP (1), length 84)
192.168.4.103 > 8.8.8.8: ICMP echo request, id 1709, seq 29, length 64
root@compute:~# tcpdump -i qvb88ab3af7-7d -n -v \ 'icmp[icmptype] = icmp-echoreply or icmp[icmptype] =
icmp-echo'
tcpdump: WARNING: qvb88ab3af7-7d: no IPv4 address assigned
tcpdump: listening on qvb88ab3af7-7d, link-type EN10MB (Ethernet), capture size 65535 bytes
10:37:18.058899 IP (tos 0x0, ttl 64, id 1516, offset 0, flags [DF], proto ICMP (1), length 84)
192.168.4.103 > 8.8.8.8: ICMP echo request, id 1709, seq 48, length 64
- and finally on the outgoing interface (em1 in the example)
# tcpdump -i em1 -n -v \ 'icmp[icmptype] = icmp-echoreply or icmp[icmptype] =
icmp-echo'
tcpdump: WARNING: em1: no IPv4 address assigned
tcpdump: listening on em1, link-type EN10MB (Ethernet), capture size 65535 bytes
10:37:49.099383 IP (tos 0x0, ttl 64, id 1547, offset 0, flags [DF], proto ICMP (1), length 84)
192.168.4.103 > 8.8.8.8: ICMP echo request, id 1709, seq 79, length 64
On the instance:
# tcpdump -i any -n -v \ 'icmp[icmptype] = icmp-echoreply or icmp[icmptype] =
> icmp-echo'
tcpdump: listening on any, link-type LINUX_SLL (Linux cooked), capture size 65535 bytes
09:27:04.801759 IP (tos 0x0, ttl 64, id 36704, offset 0, flags [DF], proto ICMP (1), length 84)
192.168.4.103 > 192.168.21.107: ICMP echo request, id 1693, seq 27, length 64
NB it can be useful to show vlan tag in traffic debugging. To do this use :
#tcpdump -i <iface> -Uw - | tcpdump -en -r - vlan <id>
iptables and security rules
OpenStack Compute automatically manages iptables, including forwarding packets to and from instances on a compute node, forwarding floating IP traffic, and managing security group rules.
iptables-save
shows you all the rules
Example of setup of security rules
to show the security rules:
# nova secgroup-list-rules default
+-------------+-----------+---------+-----------+--------------+
| IP Protocol | From Port | To Port | IP Range | Source Group |
+-------------+-----------+---------+-----------+--------------+
| | | | | default |
| | | | | default |
+-------------+-----------+---------+-----------+--------------+
to setup a rule to make icmp traffic pass through:
nova secgroup-add-rule default icmp -1 -1 0.0.0.0/0
+-------------+-----------+---------+-----------+--------------+
| IP Protocol | From Port | To Port | IP Range | Source Group |
+-------------+-----------+---------+-----------+--------------+
| | | | | default |
| | | | | default |
+-------------+-----------+---------+-----------+--------------+
Troubleshooting DNS
SSH server does a reverse DNS lookup on the IP address that you are connecting from so if you can use SSH to log into an instance, but it takes order of a minute then you might have a DNS issue.
A quick way to check whether DNS is working is to resolve a hostname inside your instance by using the host command. If DNS is working, you should see:
# host garr.it
garr.it mail is handled by 15 lx1.dir.garr.it.
garr.it mail is handled by 20 lx5.dir.garr.it.
garr.it mail is handled by 15 lx1.dir.garr.it.
garr.it mail is handled by 20 lx5.dir.garr.it.
Note If you're running the Cirros image, it doesn't have the "host" program installed, in which case you can use ping to try to access a machine by hostname to see whether it resolves.
Dealing with Network Namespaces
Linux network namespaces are a kernel feature the networking service uses to support multiple isolated layer-2 networks with overlapping IP address ranges. Your network nodes will run their dhcp-agents and l3-agents in isolated namespaces. NB Network interfaces and traffic on those interfaces will not be visible in the default namespace.
L3-agent router namespaces are named qrouter-<router_uuid>, and dhcp-agent name spaces are named qdhcp-<net_uuid>.
To see whether you are using namespaces, run ip netns:
# ip netns
qrouter-80fdf884-37c3-4d33-a340-cd1a09510e59
qdhcp-c3cfc51b-f07c-47ae-bdb4-b029035c08d7
qdhcp-f7bff056-1d27-4c12-a917-6ffe2925a44b
qrouter-edcb7cb5-37fd-4b31-81c5-cee1bda75369
qdhcp-286f2844-6b76-42e5-9664-ab5123bde2d5
qrouter-3618b020-4f3c-4a72-8c02-e25db0c4769d
qdhcp-c8a29266-e9ac-45e0-be6d-79c32f501194
qrouter-301f264a-8ef1-413d-b252-c0886fc2c815
qrouter-9d378195-ee93-45f0-b27f-2bd48b774f5a
qdhcp-13c334c1-ad39-4c51-b396-953430059b22
This output shows a network node with 5 networks running dhcp-agents, each also running an l3-agent router.
A list of existing networks and their UUIDs can be obtained by running neutron net-list with administrative credentials.
# neutron net-list
+--------------------------------------+----------------------+-----------------------------------------------------+
| id | name | subnets |
+--------------------------------------+----------------------+-----------------------------------------------------+
| 13c334c1-ad39-4c51-b396-953430059b22 | int-net-324 | edd7678a-277c-477e-a5ac-84258e6b1794 192.168.1.0/24 |
| 286f2844-6b76-42e5-9664-ab5123bde2d5 | inaf-net | dbf5bd19-de67-4b84-a97b-8e322f9343dc 192.168.3.0/24 |
| 99e9c208-b72a-427f-97f6-2443cdd6de9c | ext-net-flat-319 | e0ef8d6f-3fa9-4a05-ae2c-5ec229357f4b 90.147.91.0/24 |
| b4ef2523-bebe-4dbe-b5b7-82983fec6be8 | ext-net-flat-319-bis | 91ccda54-2af1-4a59-bf08-8bb0821c1c08 90.147.91.0/24 |
| c3cfc51b-f07c-47ae-bdb4-b029035c08d7 | int-net-328 | 0d36feb3-4c83-4867-a227-fb972564125c 192.168.8.0/24 |
| c8a29266-e9ac-45e0-be6d-79c32f501194 | ingv-net | 915f9929-e49b-4a95-a193-c71227ff870d 192.168.2.0/24 |
| f7bff056-1d27-4c12-a917-6ffe2925a44b | enea-net | d9d1ba30-4a14-4aab-a95f-4ed2c3f895d3 192.168.4.0/24 |
Once you've determined which namespace you need to work in, you can use any of the debugging tools mention earlier by prefixing the command with ip netns exec <namespace>.
For example, to see what network interfaces exist in the first qdhcp namespace returned above, do this:
# ip netns exec qdhcp-f7bff056-1d27-4c12-a917-6ffe2925a44b ip a
1: lo: <LOOPBACK,UP,LOWER_UP> mtu 65536 qdisc noqueue state UNKNOWN group default
link/loopback 00:00:00:00:00:00 brd 00:00:00:00:00:00
inet 127.0.0.1/8 scope host lo
valid_lft forever preferred_lft forever
inet6 ::1/128 scope host
valid_lft forever preferred_lft forever
61: tapd9762af3-4b: <BROADCAST,UP,LOWER_UP> mtu 1500 qdisc noqueue state UNKNOWN group default
link/ether fa:16:3e:b8:2e:0c brd ff:ff:ff:ff:ff:ff
inet 192.168.4.100/24 brd 192.168.4.255 scope global tapd9762af3-4b
valid_lft forever preferred_lft forever
inet6 fe80::f816:3eff:feb8:2e0c/64 scope link
valid_lft forever preferred_lft forever
From this you see that the DHCP server on that network is using the tapd9762af3-4b device and has an IP address of 192.168.4.100.
Usual commands also mentioned previously can be run in the same way.
note: It is also possible to run a shell and have an interactive session within the namespace i.e.
# ip netns exec qdhcp-f7bff056-1d27-4c12-a917-6ffe2925a44b bash
root@network:~# ifconfig
lo Link encap:Local Loopback
inet addr:127.0.0.1 Mask:255.0.0.0
inet6 addr: ::1/128 Scope:Host
UP LOOPBACK RUNNING MTU:65536 Metric:1
RX packets:0 errors:0 dropped:0 overruns:0 frame:0
TX packets:0 errors:0 dropped:0 overruns:0 carrier:0
collisions:0 txqueuelen:0
RX bytes:0 (0.0 B) TX bytes:0 (0.0 B)
tapd9762af3-4b Link encap:Ethernet HWaddr fa:16:3e:b8:2e:0c
inet addr:192.168.4.100 Bcast:192.168.4.255 Mask:255.255.255.0
inet6 addr: fe80::f816:3eff:feb8:2e0c/64 Scope:Link
UP BROADCAST RUNNING MTU:1500 Metric:1
RX packets:22 errors:0 dropped:0 overruns:0 frame:0
TX packets:9 errors:0 dropped:0 overruns:0 carrier:0
collisions:0 txqueuelen:0
RX bytes:1788 (1.7 KB) TX bytes:738 (738.0 B)
Mapping of physnet vs network inside neutron db
Sometimes there could be an unclear (from the logs point of view) error that claims not to find suitable resources at the moment of VM creation. It could be related to a problem in the neutron DB. To find out:
- check that nova services are running on the compute nodes and controller
# nova service-list
+----+------------------+------------+----------+---------+-------+----------------------------+-----------------+
| Id | Binary | Host | Zone | Status | State | Updated_at | Disabled Reason |
+----+------------------+------------+----------+---------+-------+----------------------------+-----------------+
| 1 | nova-compute | compute | nova | enabled | up | 2015-02-12T13:52:45.000000 | - |
| 2 | nova-cert | controller | internal | enabled | up | 2015-02-12T13:52:40.000000 | - |
| 3 | nova-consoleauth | controller | internal | enabled | up | 2015-02-12T13:52:40.000000 | - |
| 4 | nova-scheduler | controller | internal | enabled | up | 2015-02-12T13:52:45.000000 | - |
| 5 | nova-conductor | controller | internal | enabled | up | 2015-02-12T13:52:44.000000 | - |
| 6 | nova-compute | controller | nova | enabled | up | 2015-02-12T13:52:46.000000 | - |
+----+------------------+------------+----------+---------+-------+----------------------------+-----------------+
+----+------------------+------------+----------+---------+-------+----------------------------+-----------------+
| Id | Binary | Host | Zone | Status | State | Updated_at | Disabled Reason |
+----+------------------+------------+----------+---------+-------+----------------------------+-----------------+
| 1 | nova-compute | compute | nova | enabled | up | 2015-02-12T13:52:45.000000 | - |
| 2 | nova-cert | controller | internal | enabled | up | 2015-02-12T13:52:40.000000 | - |
| 3 | nova-consoleauth | controller | internal | enabled | up | 2015-02-12T13:52:40.000000 | - |
| 4 | nova-scheduler | controller | internal | enabled | up | 2015-02-12T13:52:45.000000 | - |
| 5 | nova-conductor | controller | internal | enabled | up | 2015-02-12T13:52:44.000000 | - |
| 6 | nova-compute | controller | nova | enabled | up | 2015-02-12T13:52:46.000000 | - |
+----+------------------+------------+----------+---------+-------+----------------------------+-----------------+
- check that there are enough hw resources
# nova hypervisor-stats
+----------------------+--------+
| Property | Value |
+----------------------+--------+
| count | 2 |
| current_workload | 0 |
| disk_available_least | 1130 |
| free_disk_gb | 1274 |
| free_ram_mb | 367374 |
| local_gb | 1454 |
| local_gb_used | 180 |
| memory_mb | 386830 |
| memory_mb_used | 19456 |
| running_vms | 6 |
| vcpus | 80 |
| vcpus_used | 9 |
+----------------------+--------+
- check that there is no problem in the mapping of physnet and networks in the neutron db (i.e. trunknet is our vlan tagged network)
select * from ml2_vlan_allocations;
+------------------+---------+-----------+
| physical_network | vlan_id | allocated |
+------------------+---------+-----------+
| trunknet | 319 | 0 |
| trunknet | 320 | 0 |
| trunknet | 321 | 0 |
| trunknet | 322 | 0 |
| trunknet | 323 | 0 |
| trunknet | 324 | 0 |
| trunknet | 325 | 0 |
| trunknet | 326 | 0 |
| trunknet | 327 | 0 |
| trunknet | 328 | 0 |
+------------------+---------+-----------+3 2
Debugging with logs - where Are the Logs?
Following reported a quick summary table of the services log location, more in “OpenStack log locations”.
Node type
|
Service
|
Log location
|
Cloud controller
|
nova-*
|
/var/log/nova
|
Cloud controller
|
glance-*
|
/var/log/glance
|
Cloud controller
|
cinder-*
|
/var/log/cinder
|
Cloud controller
|
keystone-*
|
/var/log/keystone
|
Cloud controller
|
neutron-*
|
/var/log/neutron
|
Cloud controller
|
horizon
|
/var/log/apache2/
|
All nodes
|
misc (swift, dnsmasq)
|
/var/log/syslog
|
Compute nodes
|
libvirt
|
/var/log/libvirt/libvirtd.log
|
Compute nodes
|
Console (boot up messages) for VM instances:
|
/var/lib/nova/instances/instance-<instance id>/console.log
|
Block Storage nodes
|
cinder-volume
|
/var/log/cinder/cinder-volume.log
|
Backup + Recovery (for Real)
This chapter describes only how to back up configuration files and databases that the various OpenStack components need to run. This chapter does not describe how to back up objects inside Object Storage or data contained inside Block Storage.
Database Backups
The cloud controller is the MySQL server hosting the databases for nova, glance, cinder, and keystone. To create a database backup:
#mysqldump -u <admin user> -h controller -p --all-databases > openstack.sql
To backup a single database (i.e. nova) you can run:
#mysqldump -u <admin user> -h controller -p nova > nova.sql
You can easily automate this process. The following script dumps the entire MySQL database and deletes any backups older than seven days:
#!/bin/bash
backup_dir="/var/lib/backups/mysql"
filename="${backup_dir}/mysql-`hostname`-`eval date +%Y%m%d`.sql.gz"
# Dump the entire MySQL database
/usr/bin/mysqldump -u root -p123grid --all-databases | gzip > $filename
# Delete backups older than 7 days
find $backup_dir -ctime +7 -type f -delete
File System Backups
Compute
The /etc/nova directory on both the cloud controller and compute nodes should be backed up.
/var/lib/nova is a directory to back up.
note: it’s unuseful to backup /var/lib/nova/instances subdirectory on compute nodes which contains the KVM images of running instances unless you need to maintain backup copies of all instances.
Image Catalog and Delivery
/etc/glance and /var/log/glance should be backed up
/var/lib/glance should also be backed up.
There are two ways to ensure stability with this directory. The first is to make sure this directory is run on a RAID array. If a disk fails, the directory is available. The second way is to use a tool such as rsync to replicate the images to another server:
# rsync -az --progress /var/lib/glance/images backup-server:/var/lib/glance/images/
Identity
/etc/keystone and /var/log/keystone follow the same rules as other components.
/var/lib/keystone, should not contain any data being used.
Recovering Backups
Recovering backups is a simple process.
- ensure that the service you are recovering is not running. I.e. in the case of nova:
# stop nova-cert
# stop nova-consoleauth
# stop nova-novncproxy
# stop nova-objectstore
# stop nova-scheduler
# stop nova-consoleauth
# stop nova-novncproxy
# stop nova-objectstore
# stop nova-scheduler
- import a previously backed-up database:
#mysql -u root -p --one-database neutron </root/mysqldump_20150210
- restore backed-up nova directories:
#mv /etc/nova{,.orig}
#cp -a /path/to/backup/nova /etc/
- start everything back up
#for i in nova-api nova-cert nova-consoleauth nova-novncproxy nova-scheduler; do start $i; done
Appendix
Debugging Nova
To know the flow for provisioning an instance could be useful to identify a problem in the chain:

- The dashboard or CLI gets the user credentials and authenticates with the Identity Service via REST API.
- The Identity Service authenticates the user with the user credentials, and then generates and sends back an auth-token which will be used for sending the request to other components through REST-call.
- The dashboard or CLI converts the new instance request specified in launch instance or nova-boot form to a REST API request and sends it to nova-api.
- nova-api receives the request and sends a request to the Identity Service for validation of the auth-token and access permission.
- The Identity Service validates the token and sends updated authentication headers with roles and permissions.
- nova-api checks for conflicts with nova-database.
- nova-api creates initial database entry for a new instance.
- nova-api sends the rpc.call request to nova-scheduler expecting to get updated instance entry with host ID specified.
- nova-scheduler picks up the request from the queue.
- nova-scheduler interacts with nova-database to find an appropriate host via filtering and weighing.
- nova-scheduler returns the updated instance entry with the appropriate host ID after filtering and weighing.
- nova-scheduler sends the rpc.cast request to nova-compute for launching an instance on the appropriate host.
- nova-compute picks up the request from the queue.
- nova-compute sends the rpc.call request to nova-conductor to fetch the instance information such as host ID and flavor (RAM, CPU, Disk).
- nova-conductor picks up the request from the queue.
- nova-conductor interacts with nova-database.
- nova-conductor returns the instance information.
- nova-compute picks up the instance information from the queue.
- nova-compute performs the REST call by passing the auth-token to glance-api. Then, nova-compute uses the Image ID to retrieve the Image URI from the Image Service, and loads the image from the image storage.
- glance-api validates the auth-token with keystone.
- nova-compute gets the image metadata.
- nova-compute performs the REST-call by passing the auth-token to Network API to allocate and configure the network so that the instance gets the IP address.
- neutron-server validates the auth-token with keystone.
- nova-compute retrieves the network info.
- nova-compute performs the REST call by passing the auth-token to Volume API to attach volumes to the instance.
- cinder-api validates the auth-token with keystone.
- nova-compute retrieves the block storage info.
- nova-compute generates data for the hypervisor driver and executes the request on the hypervisor (via libvirt or API).
Configuration options
All the details about configuration options can be found here http://docs.openstack.org/juno/config-reference/content/index.html
it`s difficult to read since some text are almost invisible. may be change the bg color or font color? :D
ReplyDeleteuse the link for the updated version
Delete